Lead & Platform Architect · ~1 year · small team
Architecting an Oil-Spill Detection Platform on Satellite SAR
As lead and platform architect, I took an oil-spill detection platform from a promising detection model to a system whose alerts analysts could trust — owning the architecture and technical direction, and leading a small team, including the data scientist behind the models, on a Next.js, NestJS and PostGIS stack.
- Sentinel-1
- SAR radar imagery
- AI
- detection over every pass
- PostGIS
- spatial source of truth
- Real-time
- spatial analytics
- Lead
- architecture & direction
- ~1 yr
- from Dec 2024
Context
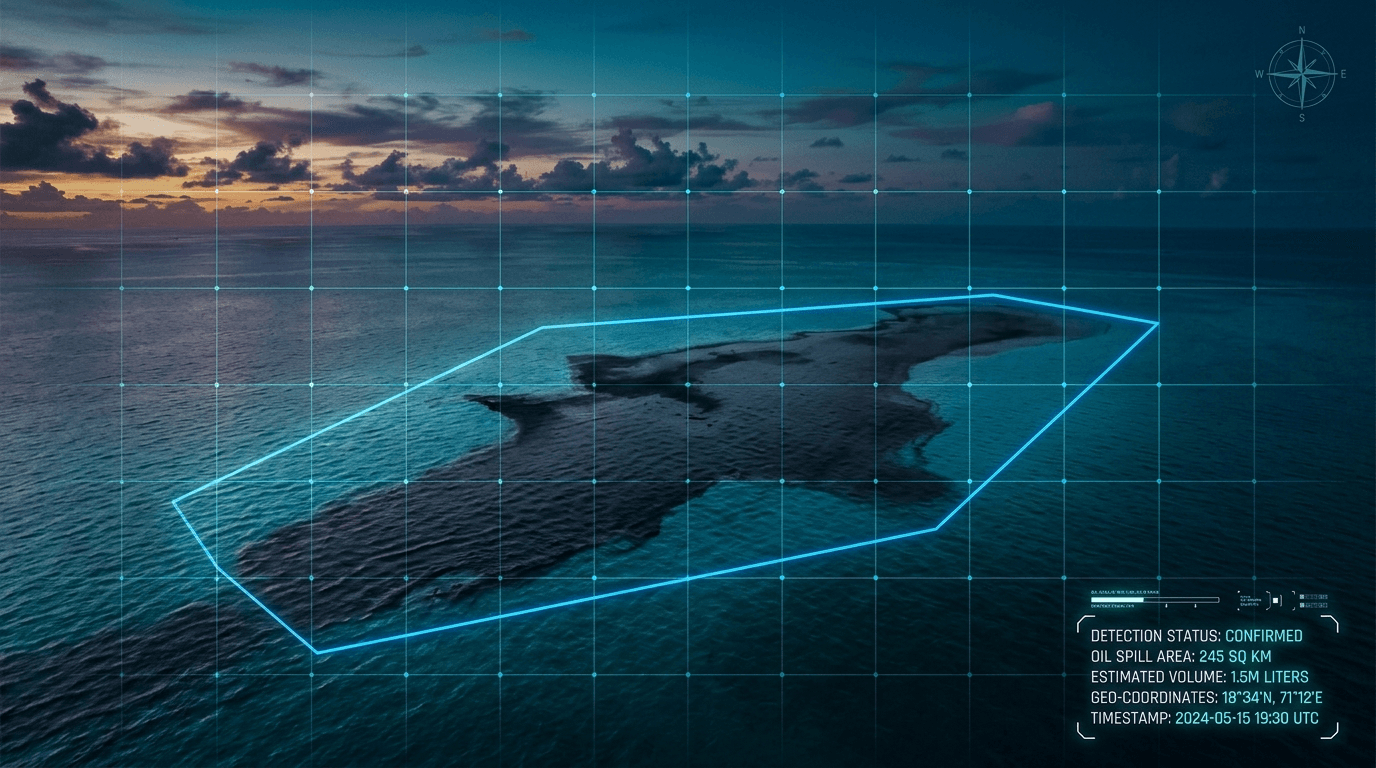
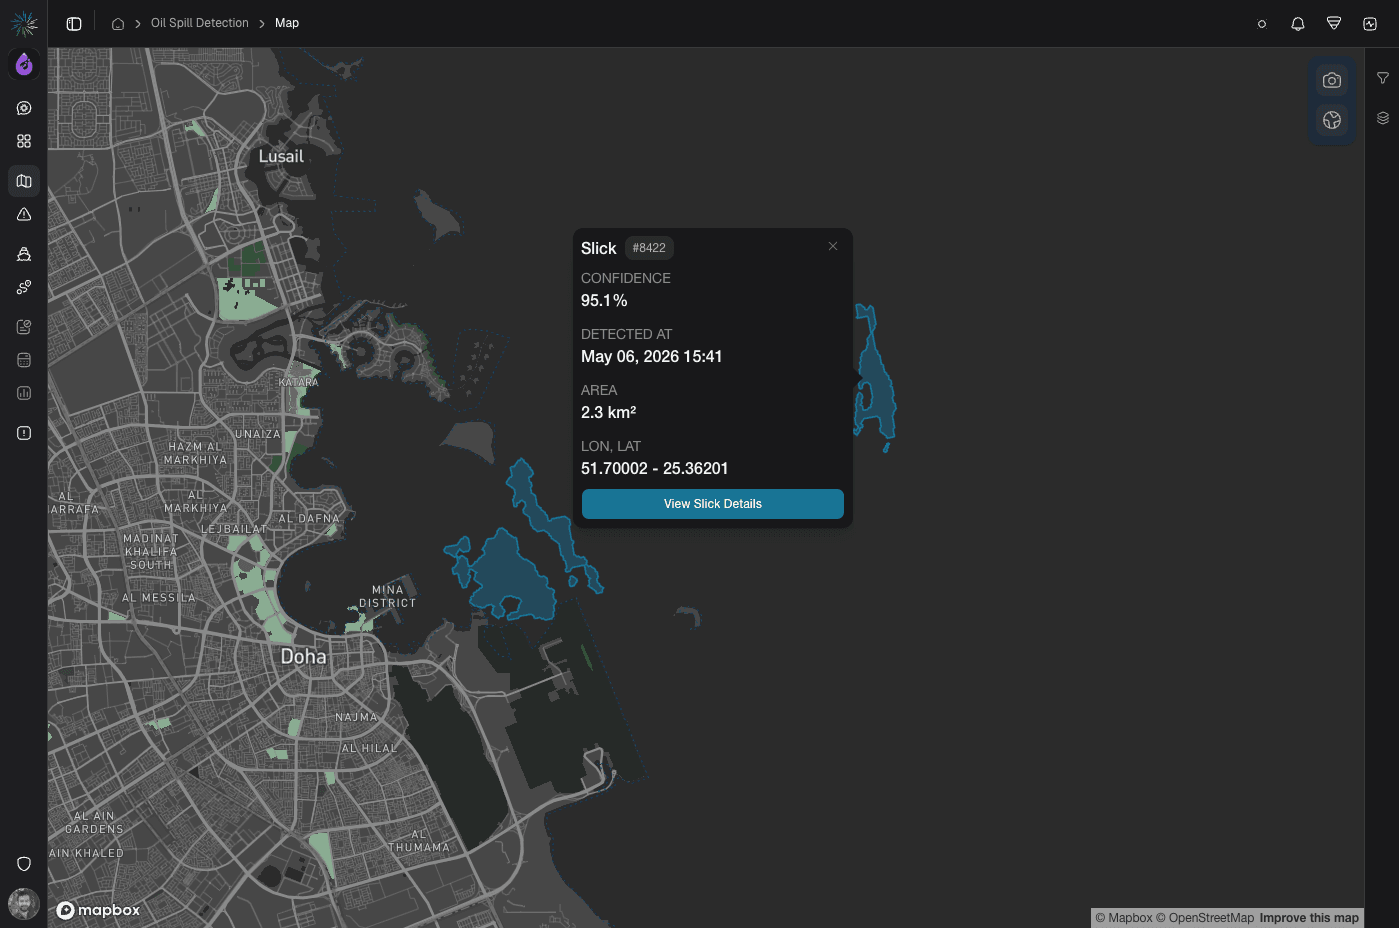
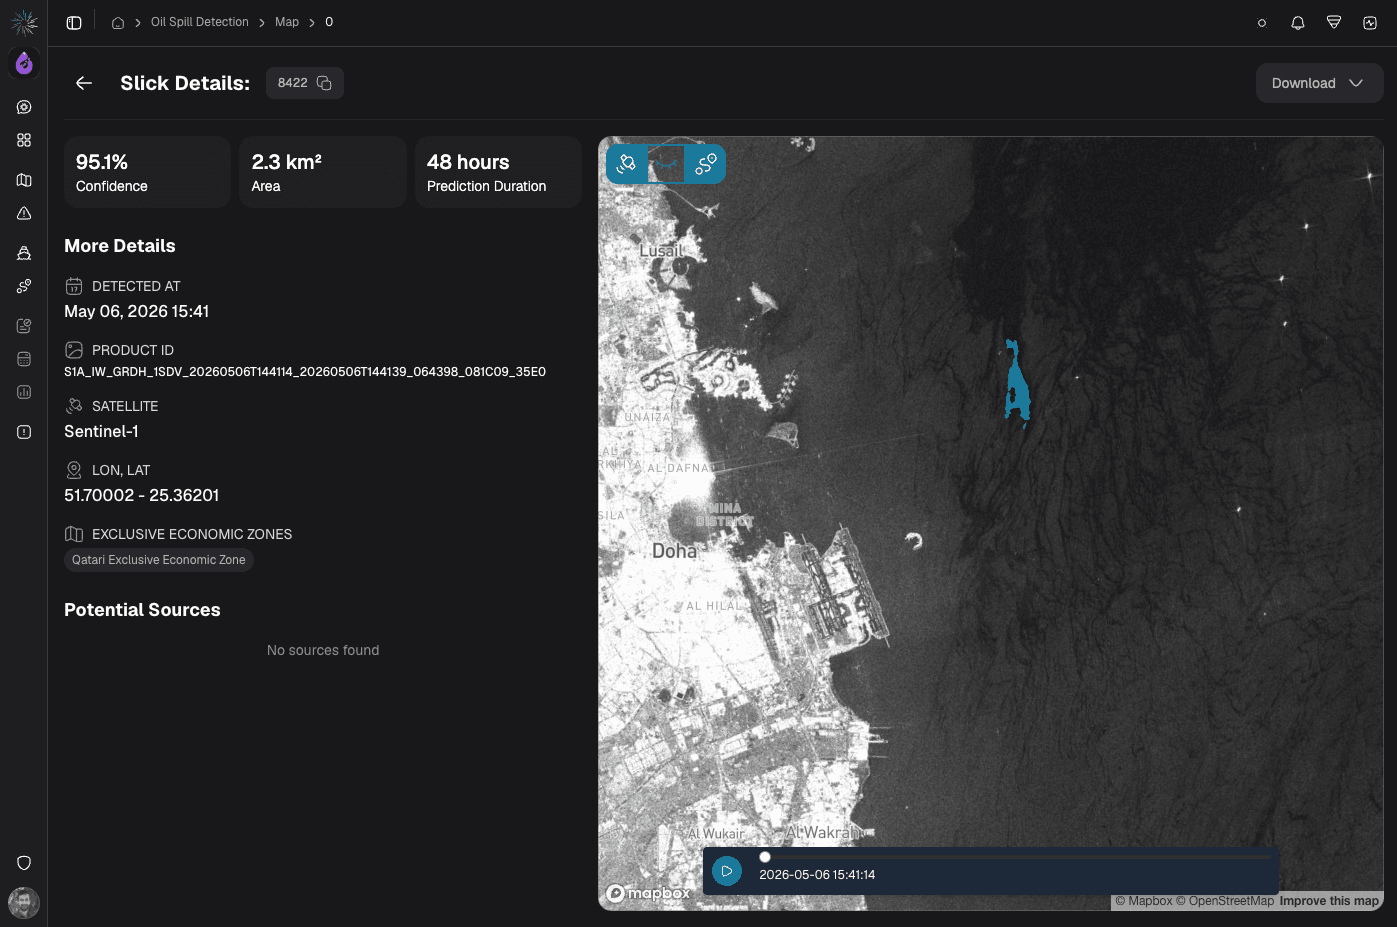
The platform detects, monitors and analyzes oil spills across marine environments from satellite radar. It ingests Sentinel-1 SAR scenes — each a wide swath of ocean at ten-metre resolution — runs AI detection over every pass, and layers the results onto PostGIS spatial analytics, putting a trustworthy slick on an analyst's live map soon after the satellite crosses.
The challenge
Oil versus look-alikes in radar imagery
On synthetic-aperture radar, oil dampens surface waves and reads as a dark patch — but so do low-wind cells, biogenic slicks, rain and ship wakes. The dark smear is the easy part; deciding whether it is oil is the whole problem. Real spills are rare, so even a small false-positive rate buries analysts in alerts they stop trusting.
From a detection model to a live platform
A model that finds oil in a research notebook is a long way from a service that runs on every satellite pass, holds up under bursts of gigabyte-scale scenes, and puts a result on a map while there is still time to act. Closing that gap — reliability, latency and spatial context — was the platform problem to solve, and it is where my work lived.
My approach
Architected a clean pixels/geometry boundary
I drew a hard line through the system: Python and GDAL workers own the pixels — SAR calibration, inference, vectorization — while NestJS owns geometry-as-data and business logic, wired through a job queue rather than direct calls, with PostGIS as the single source of truth. It let the data scientist iterate on models freely while the platform stayed stable, and made clear which service owned any failure.
Directed detection strategy for trust, not just accuracy
I set the technical direction with my data scientist: treat false alarms as the primary enemy and model the look-alikes explicitly rather than hunt only for oil, then harden each detection with platform context — correlating candidates against AIS ship tracks and checking persistence across repeat passes in PostGIS — so context, not a raw model score alone, decided what became an alert.
Owned the bigger picture and the delivery
I owned the roadmap and the architecture, kept the platform pointed at what analysts actually needed, and led a small team — including the data scientist behind the detection — from prototype toward an operational service.
Outcome
- A research-grade detector grew into a platform that runs on live satellite passes.
- Modeling look-alikes and layering spatial context turned raw detections into alerts worth trusting.
- A small team delivered a hard Earth-observation problem end-to-end, from satellite pixels to a decision-ready map.
Gallery
Stack
- Next.js
- NestJS
- PostGIS
Need a senior software engineer in Dubai who can lead a build like this end-to-end?
Get in touch →